Okay, we've covered the bond market (https://theeconomiccurmudgeon.blogspot.com/2023/05/bonds-yield-curve-and-recession.html), and we've introduced the yield curve - what determines it, what it normally looks like, how it can change, and what it generally means when it's inverted (https://theeconomiccurmudgeon.blogspot.com/2023/05/bonds-yield-curve-and-recession_9.html). Now it's time to take a deeper dive into the yield curve as an indicator of economic turning points. We'll also talk about at least one other indicator of economic downturns. But first, let's review some yield curve basics.
Below is an illustration of a normal, upward-sloping yield curve:

Next, let's review what an inverted yield curve looks like:

Finally, let's review the spread between the ten-year Treasury yield and the two-year Treasury yield, which illustrates the inversion of the yield curve (when the spread is negative - i.e., when the two-year yield is higher than the ten-year yield - the curve is inverted):

To recap, the normal yield curve is upward-sloping because we generally expect the economy to grow over the long run, so the expectations theory tells us that the Fed will be raising rates over the long run to rein in inflation. Thus, under normal conditions, and when the economy is growing (and is expected to continue to grow), the yield curve will generally be upward-sloping, with long yields higher than short yields.
It's important for us to to address why we consider this normal. The third graph above answers that question. From that graph, you can see that the yield curve is normally (most often) upward-sloping - the ten-year yield normally exceeds the two-year yield. The graph shows that the curve has only been inverted for relatively short periods of time, and those periods have been relatively few and far between.
For example, we see from the graph that the curve was inverted from the late 1970s through the early 1980s, with a couple of brief periods where the spread between the ten-year and the two-year turned positive, only to invert and become negative again. Then, the spread was positive until the late 1980s, at which point it became negative again, for a period of a couple of years. By about 1990, it was positive again, and it remained so, with the exception of a brief dip in the late 1990s, until about 2000, when the curve again inverted for a short period. The spread was positive from about 2001 until the mid-2000s, when the curve inverted once more, for about two years, again with a brief correction. After 2007, the spread was positive until 2022 (other than a very brief dip into negative territory in 2019, but only for two days, and only by 3-4 basis points).
This is intuitive. Remember that we said that an inverted yield curve has preceded nearly every U.S. recession? Well, as illustrated by the shaded bars in the third graph above, which represent recessions, there have been only six recessions in the last 47 years. (There's actually one recession shown on the graph that was an anomaly; we'll discuss it later.) Those recessions lasted, on average, less than ten months each. So for 60 out of the last 560 or so months (less than 11% of the time), we've been in recession. The rest of the time, we haven't been. So we'd say that recessions aren't the norm, and thus the normal state of the economy is growth. That supports the expectation that the economy is going to grow over the long run, and thus that future Fed moves will be to raise rates, which would make an upward-sloping yield curve the norm, according to the expectations theory.
Another critical point to make is that there has to be some reason that an inverted yield curve signals a future recession. Otherwise, it's merely a coincidence. For example, you've probably heard it said that since the 1929 stock market crash that precipitated the Great Depression, a recession has occurred, on average, every seven years. This has led some people to conclude that, when we're about six years past the last recession, "we're due for another one."
That's simply not the case. Recessions aren't like phases of the moon or solar eclipses; they're not tied to the calendar. The fact that one has occurred, on average, every seven years, is mere coincidence. The time between recessions, since the Great Depression, has varied as follows (I'm rounding to whole years):
- Four years
- Seven years
- Three years
- Three years
- Three years
- Two years
- Nine years
- Three years
- Five years
- One year
- Eight years
- Ten years
- Six years
- Eleven years
That averages to seven years, but as you can see, the variance is wide - from one year to eleven years. There's nothing to indicate that once the economy has grown for six years, a recession is "due," nor is there anything to suggest that the economy will grow for seven years without a recession occurring. The seven-year average is coincidental.
There are similar coincidences in the stock market. It used to hold true that if the Super Bowl winner was an NFC or original NFL team, the market would be up for the year, and if the winner was an AFC or original AFL team, the market would be down. Obviously, the winner of the Super Bowl doesn't determine the performance of the stock market; it was merely a coincidence. And it eventually broke down.
See, something has to cause a recession. It doesn't just happen. And that's a critical point in our discussion in this post.
So how does that relate to an inverted yield curve being a leading indicator of a recession? Is that mere coincidence as well?
No, it is not. In our last post, we established that the yield curve inverts because investors and traders at the long end begin to see signs of emerging economic weakness - they see signs of a recession on the horizon. And they believe that the Fed is going to start cutting rates (easing) in response to that weakness, such that in the long-term (relatively speaking), rates will be lower. So they bid yields at the long end of the curve lower to reflect those expectations, even though the Fed may still be raising rates, because the recession isn't here yet, and the economy is still growing. (And remember, we said that the Fed has a tendency to overshoot monetary policy, so it may continue tightening longer than it should.)
So there's a very good reason why the yield curve inverts prior to a recession: there are fundamental signs that a recession is coming, and traders see those signs on the horizon, and start to bid down yields at the long end of the curve accordingly.
The third graph above shows that the yield curve inverted prior to every recession since the recession of 1980. (I'm not counting the 2020 recession, nor the 2019 "inversion." I'll explain why shortly.) This validates the reliability of the inverted yield curve as a leading indicator of recessions. And it makes sense, for the reasons noted above. Bond traders and investors are pretty smart, and they watch economic data closely. So they're pretty good at seeing signs of economic weakness, and they respond to them with their trades.
Now, let's take a brief detour. Why don't I count the recession of 2020? Because it wasn't caused by any of the fundamental economic factors we normally associate with a recession. The economy in 2019 was very strong. Unemployment was at historic lows. Every economic indicator showed strength. Nobody in their right mind predicted a recession.
Then, the covid pandemic hit. And the government took the unprecedented and previously unimaginable step of shutting down the U.S. economy, causing the loss of 22 million jobs in just six weeks. Want to know what that looks like? Check out this graph of non-farm payrolls:
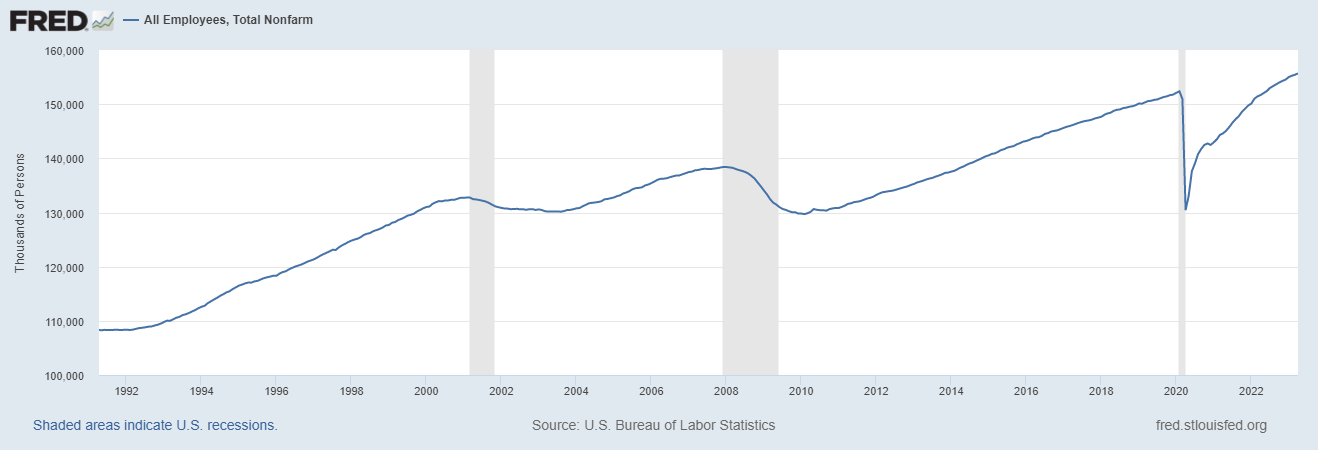
Look at the magnitude of the drop in 2020. It's massive.
This was a bottom-up recession, as I discussed in this blog at the time. That's never happened before; recessions tend to be top-down, with jobs at the top of the economy (i.e., the highest earners) being lost first, and that trickles down to lower-paying service sector and retail jobs. The covid shutdown eliminated the service sector and retail jobs - retail stores, hotels, restaurants, etc. Earners at the higher end of the pay spectrum kept their jobs, for the most part. (That's the primary reason the recovery was so rapid.)
So I discount the 2020 recession because it was an anomaly. Unlike every other recession, which have been naturally occurring, the 2020 recession was manufactured - it was forced upon us, by the government shutting down the economy, not by the economy encountering fundamental weakness and contracting.
Likewise, I discount the "inversion" that occurred in 2019 because that, too, was an anomaly. Again, nobody anticipated the 2020 recession. Nobody saw covid coming (except maybe Anthony Fauci, and he's not smart enough to be a bond trader). Also, as noted above, the two-year yield only exceeded the ten-year yield for two days in September 2019, and by only 3-4 basis points. It was more of a flattening of the yield curve than a true inversion. It happened because the bond market began to speculate that the Fed had once more overdone a series of rate hikes between 2016 and 2019, which sparked fears that higher interest rates could potentially slow the economy.
Those fears proved to be unfounded; jobs grew by about a million in the five months from September 2019 to February 2020, and every other economic indicator was strongly positive. You can see from the 10-year/2-year spread graph how quickly the bond market realized the fallacy of its fears. (Also, the Fed began cutting rates about three weeks before the 10-year yield dipped below the 2-year yield, helping to allay fears that the Fed was going to choke off growth, and Fed officials were signaling that there were more rate cuts to come.)
Okay, so we've established that recessions happen for a reason (except for the 2020 recession - well, it happened for a reason, but not a naturally-occurring one), and that there's a good reason that an inverted yield curve is a leading indicator of a recession, based on bond market expectations. So what's all this about a false notion about the yield curve as an indicator of recessions?
There is a theory - actually, it's more of a notion, and really it's a misconception - that while an inverted curve does precede a recession, it's not a great indicator of an imminent recession, because the curve often inverts well before recession ensues. That's true. For example, the curve inverted 17 months before the 1980 recession; 19 months before the 1990 recession; 13 months before the 2001 recession; and 16 months before the 2007 recession (it briefly inverted before that, then corrected before inverting again). But some investors try to time the market (with little success), so they want to know exactly when a recession is going to start. Just knowing a recession is coming isn't good enough for them.
So in an effort to meet that need, proponents of this notion argue that a better indicator of an imminent recession is the "uninversion" of the yield curve. Again looking at our graph of the 10-year/2-year spread, they argue that the yield curve "uninverted" prior to the recessions in 1990, 2001, and 2007. They also use the flattening of the curve in 2019 as an example of an inversion, and claim that the curve subsequently "uninverted" before the 2020 recession. These "uninversions," they argue, occurred just three months before the 1990 recession; two months before the 2001 recession; six months before the 2007 recession; and five months before the 2020 recession. On the basis of their observations of those four recessions, they claim that the yield curve has "uninverted" just prior to every recession.
Let's unpack this notion. First, who are the people who promote this idea? They're not economists; I haven't seen or heard one economist put forth this idea. And they're certainly not in the bond business. I spent four years trading, managing and hedging bonds on the buy side, and 21 years on a bond desk as an investment advisor, running an advisory desk, as an economist, and as CEO of a bond sales and advisory firm, and I never once encountered this notion.
In fact, not once in those 25 years did I ever come across the term "uninversion." When the yield curve is no longer inverted, we don't say that it "uninverted." At least no one who knows anything about the bond market uses that term. Since the normal state of the curve is upward-sloping, when the curve returns to that shape, we say that it "reverts" to normal, just as in statistics we say that after a certain data series undergoes an anomalous period, it reverts to the mean, or to its normal state.
For example, the pace of home price appreciation in a given market is mean-reverting. When something happens that results in the pace of home price appreciation exceeding the long-term mean in a given market - like historically low interest rates - there will inevitably be a correction. That happened after the early 2000s, when then-record low mortgage rates resulted in rapid home price appreciation that resulted in a historic housing bubble, which burst in 2007, resulting in a massive correction before home price appreciation reverted to the mean. It happened again in 2021 and 2022, when again record low mortgage rates fueled a home price bubble, which is now correcting as price appreciation is reverting to the mean.
So any knowledgeable economist or bond trader or investor would say that an inverted curve reverts to normal. As far as I can observe, the people that use the term "uninversion" and promote this theory fall into four camps: 1) some fringe equity fund managers and equity-centric investment advisors who don't understand the bond market; 2) people who write those far-out investment blogs that promote conspiracy-esque theories like the GameStop and AMC stock aficionados; 3) business journalists (and I believe I've already established how knowledgeable they are); and 4) people on social media who follow those in the first three camps, and don't know anything about the bond market or the yield curve, but want to sound like they know something the rest of you don't know.
Okay, so back to their "theory." It kind of looks like it's valid. Is it?
Well, first, note that they conveniently ignore the 1980 recession, which began while the curve was still inverted. Likewise, they ignore the 1981 recession, which also began while the curve was still inverted. Now, if they were smart, they'd try to argue that those recessions occurred before the monetarist era was really underway. Only a) that's a disconnect; it would have nothing to do with why those recessions ensued while the curve was still inverted, and b) it would be incorrect, because the monetarist era began in 1979, and c) they don't know what the monetarist era is, which is probably why they don't attempt to make that argument. In any event, by excluding those recessions, their claim that every recession has been preceded by an "uninversion" falls flat.
The fact of the matter is, they exclude those recessions because they don't fit their pattern.
They also include the 2020 recession, and the 2019 flattening as an "inversion." But the curve didn't meaningfully invert, nor can we argue that it reverted to normal, in 2019, and again, nobody could have seen the 2020 recession coming, so that doesn't hold water. They only include those anomalies because, again, including them supports their pattern.
Also, they've been arguing recently that the curve is once again on the precipice of "uninverting." Every time there's a move in bond yields that results in the curve becoming less inverted (i.e., the spread between the 2-year and 10-year yields narrowing), they claim that "uninversion" is just around the corner, and that when that happens, a recession is imminent. In other words, they tend to be doomsayers. And I'll comment on doomsayers in a few minutes.
The problem with the claim that the inverted yield curve is about to become "uninverted" is that it simply isn't true. The curve is currently inverted by about 47bp. In early March, before the failure of Silicon Valley Bank and Signature Bank, it was inverted by nearly 90bp. But the panic over those bank failures led to a flight to quality, which led to a flurry of bond-buying that resulted in lower yields on the two-year relative to the ten-year, and that resulted in the spread between the two narrowing. However, the curve has been inverted by at least 40bp since last October, and the inversion has averaged about 50bp for the two months since those bank failures. It would take a massive move in Treasuries for the curve to no longer be inverted. And the people who push this notion are the same people who argue that large moves in Treasury yields rarely happen, so they contradict themselves.
(I should also note that these same doomsayers claimed that those bank failures signaled a systemic banking crisis in the U.S.)
The thing about doomsayers is this: if they make their claims long enough, eventually they may turn out to be true. In other words, if they keep saying a recession is imminent, eventually, there will be a recession. Then, they'll say, "See? I told you so."
Just as there has to be a reason that the curve inverts before a recession, there would have to be a reason that it reverts to normal (or "uninverts," in the lexicon of the uninformed) immediately before a recession, for that to be a reliable indicator. And the proponents of this "theory" can't point you to one.
Well, I can tell you why the curve reverted to normal prior to the recessions in 1990, 2001, and 2007:
The Fed had already begun easing before those recessions began.
In June 1989, the Fed began cutting the Fed funds target, after having raised it by about 400bp over the previous two years. By the time the 1990 recession began, they had cut the funds target by more than 150bp. However, it wasn't enough, and the recession hit in July 1990 (largely brought on by the S&L crisis of the 1980s).
In January 2001, the Fed cut the funds target by a whopping 100bp in one move (they normally move 25bp at a time), but that wasn't enough either; the recession began in March, as a result of the dot-com bubble bursting. And in September 2007, they again cut the target rate by a larger-than-normal 50bp, and continued easing, but it once again was insufficient to prevent the recession that began in December, which resulted from the housing crisis.
In all three of those cases, as soon as the Fed began easing, or signaled that it would, bond traders began bidding up long-term yields, and bidding down short-term yields, and the curve reverted to normal.
And the reason the recessions of 1980 and 1981 began while the curve was still inverted is because the Fed was still increasing rates at that time. Volcker raised the funds target from an average of just over 11% in 1979 to 20% in June 1981. The 1980 recession began in January, and the 1981 recession began in July. Those recessions happened largely because the Fed raised short-term rates so high.
So the yield curve reverts to normal when the Fed begins easing, not when a recession is imminent. It may be a coincidence that the Fed begins easing when a recession is imminent, if their timing is right. But a better indicator that a recession is imminent is that the Fed begins easing, not that the yield curve "uninverts." That's just coincidental poppycock.
The yield curve will not revert to normal because of movements in bond yields per se. Recent large movements have been primarily due to irrational fears over the banking sector's health. For example, on March 13, there was a sizeable move in bond yields that brought these "uninversion" proponents out of the woodwork and had them proclaiming that the curve was "uninverting" rapidly, and thus recession was nigh. Guess what precipitated that move in bonds on March 13?
Signature Bank failed on March 12, two days after Silicon Valley Bank failed.
The yield curve will revert to normal when and if the Fed begins easing, and then you can bet a recession will be just around the corner - not because the yield curve reverted to normal, or because the Fed started easing, but because of economic weakness that has been emerging for quite some time, as the bond market has seen coming since the curve inverted last July. The Fed will begin easing because of that weakness, not vice-versa.
Now, one last mythical notion that I've recently seen regarding recessionary signals. Some of these same folks have claimed that "unemployment is a lagging indicator, because it tends to peak after a recession has ended."
Well, the second part of that statement is true. The unemployment rate peaked after the end of nearly every U.S. recession since WWII (the peak in unemployment coincided with the ends of the 1948-49 recession and the 1980 recession, and I'm not counting the 2020 recession, though the peak coincided with the end of that anomaly, too). However, the graph below shows that an increasing jobless rate was a leading indicator of the recessions that began in 1948, 1953 (barely), 1957, 1960, 1973 (again, barely), 1980, 1990 (barely again), 2001, and 2007 (and I'm not counting 2020, because the economic shutdown was what caused unemployment to skyrocket that year). It was a coincident indicator of the recessions that began in 1969 and 1981, and if you want to say it was a coincident indicator of the recessions that started in 1953, 1973, and 1990, I'm okay with that, too.

Anyone who understands economics knows that for an indicator to be leading, concurrent, or lagging, we don't look at when it peaks, we look at when it signals a turning point. In other words, you look at the leading edge, not the trailing edge. And the graph above clearly shows that the unemployment rate has never been a lagging indicator.
Now, we've established that the yield curve is signaling a recession. However, the unemployment rate just fell from 3.5% in March to 3.4% in April. So can a recession really be on the horizon, if the labor market is strong?
This is why I've always looked at "the numbers behind the numbers." Consider these other facts about the labor market:
- The only reason the unemployment rate declined in April was because the labor force declined. Besides normal retirement, people typically exit the labor force for one of two reasons: their employers incent them to, or they become discouraged with their prospects for employment. In the former case, companies incent people to leave the labor force in order to trim their payrolls, in advance of outright layoffs. In the latter case, it means people are having trouble finding suitable jobs that match their skills.
- Non-farm payroll growth is decelerating, and the February and March numbers were revised lower.
- Job openings have declined by about 2.5 million over the last year. That's equal to the decline experienced when the government shut down the economy in response to the pandemic; it just took longer. The last two job openings reports have been significant downside surprises.
- Temporary jobs have declined for three consecutive months. Companies tend to cut temp jobs first, before laying off permanent workers.
- The average workweek has declined steadily since the beginning of 2021. Besides cutting temp jobs, companies cut overtime in advance of cutting jobs outright.
So there are definitely cracks in the labor market. (These are just some of the signs that the bond market was seeing back in July of 2022, when the yield curve began to invert.) And we're not in recession yet. Thus labor is very much a leading indicator of recessions.
For anyone who's suffered through all three of these posts, kudos. I hope it's been informative, and educational. And I hope it's dispelled any myths you may have seen floating around about what is and is not an indicator of an imminent recession. Remember, there has to be a reason that something is a recessionary signal; otherwise, it's just a coincidence, like which conference's team won the Super Bowl.
No comments:
Post a Comment